Table 1
A Table 1 is a baseline characteristics table used in clinical and epidemiological studies to describe the study population. It typically summarizes demographic and clinical covariates such as age, gender, and selected conditions.
Table 1 is commonly used to:
- Provide a quick overview of who is in the cohort.
- Compare subgroup characteristics.
- Support transparency and reproducibility in study reporting.
- Validate that cohort filters and concept selections produced the expected population profile.
Create a Table 1 in Data2Evidence
Use the following workflow to generate Table 1 from a cohort in Data2Evidence.
Step 1: Create and materialize a cohort
Create a D2E cohort by adding your inclusion and exclusion filters in the cohort builder and save.
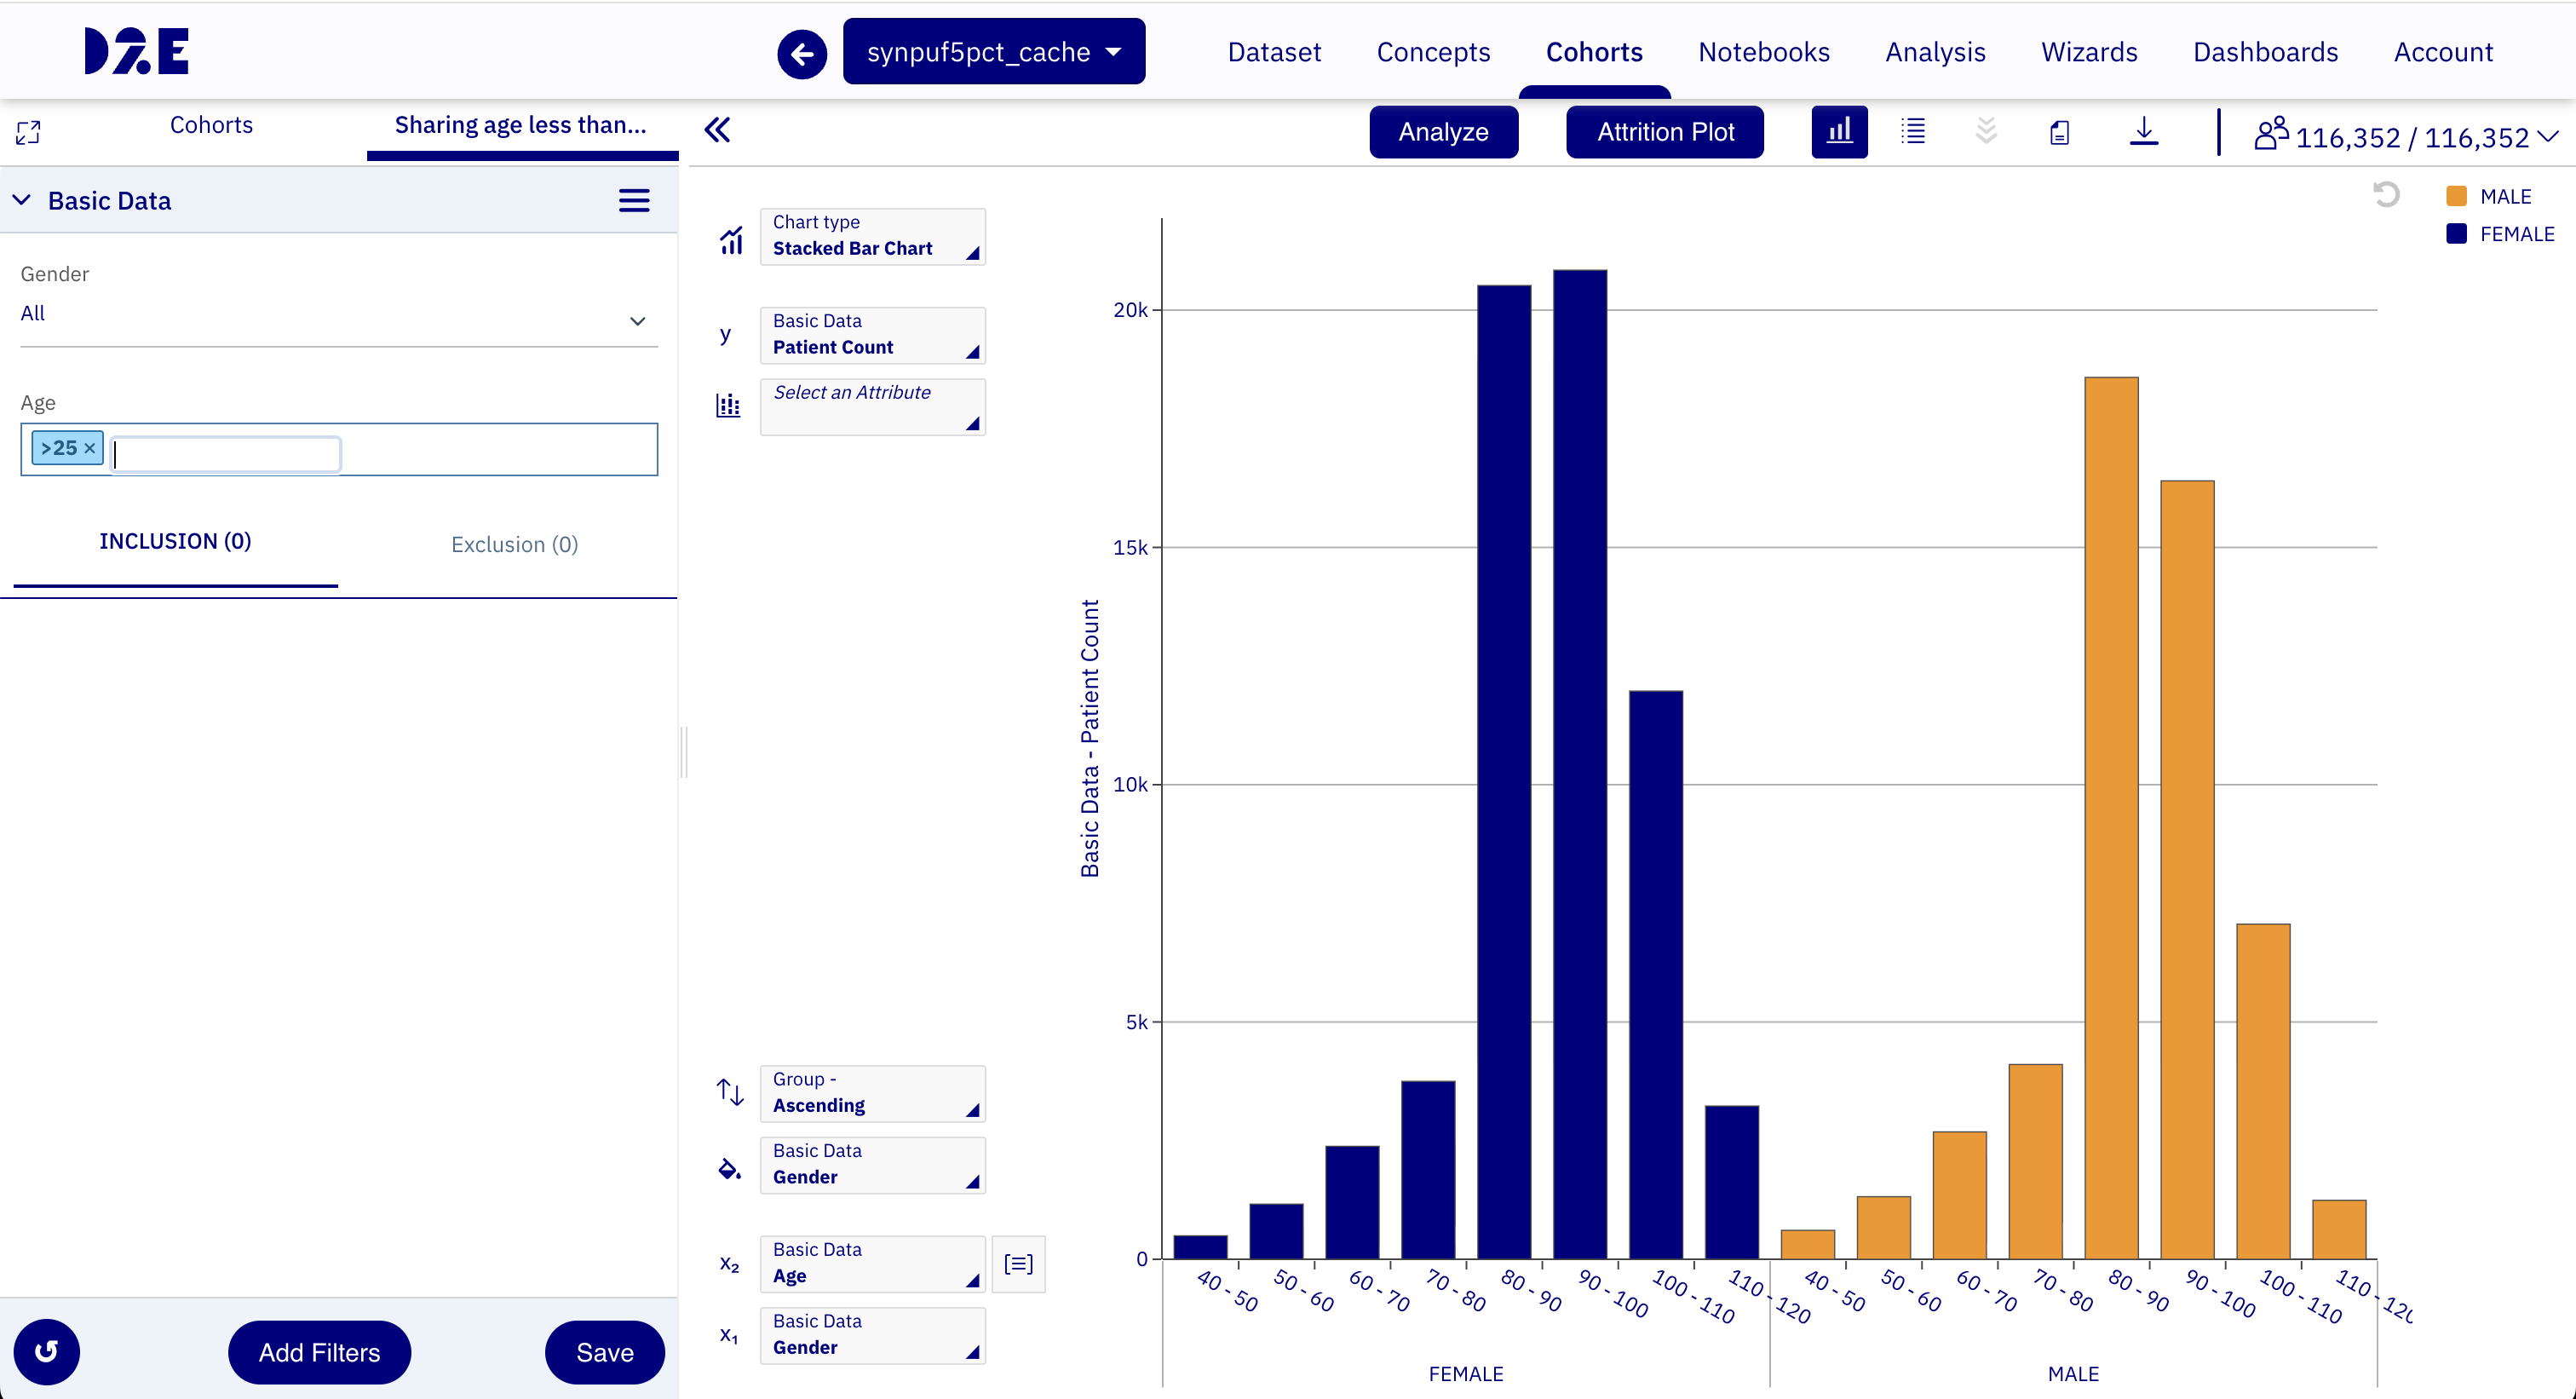
Step 2: Open analysis dashboards
Click the Analyze button for the materialized cohort. This opens the analysis popup with available dashboards, including Table 1.
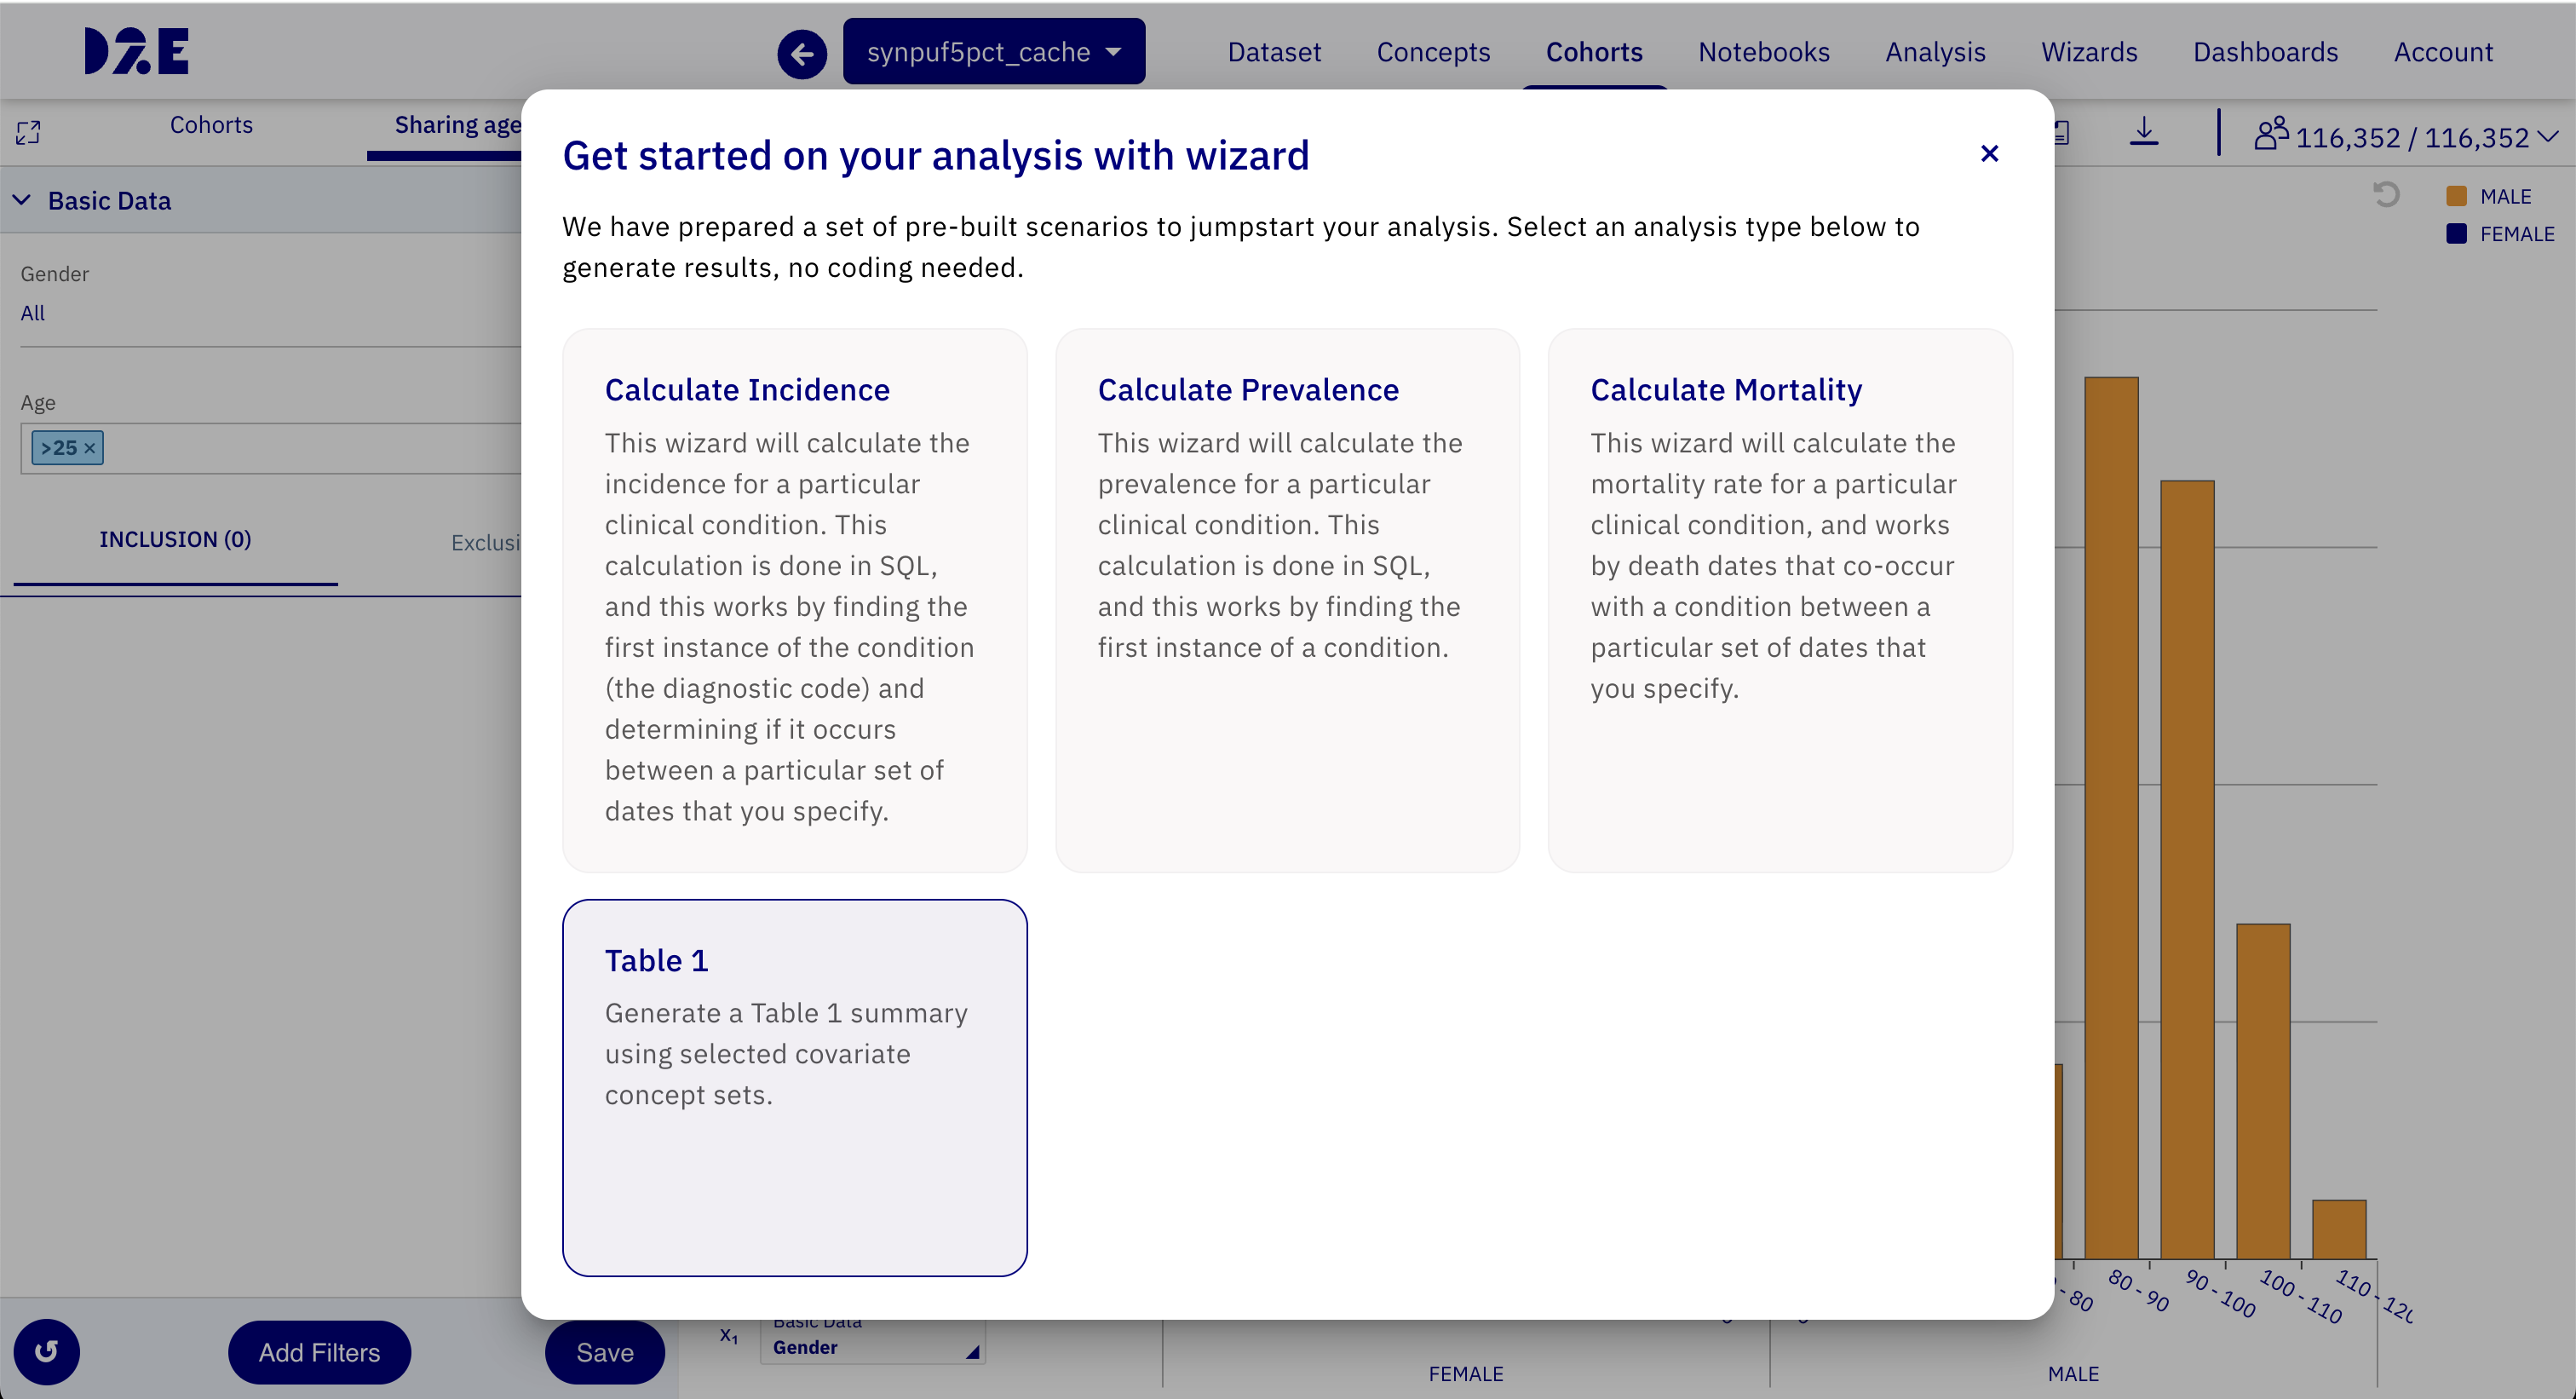
Step 3: Select concept sets
When Table 1 is launched, you are prompted to select concept sets.
- You can select one or more existing concept sets.
- You can also create a new concept set by adding concept IDs.
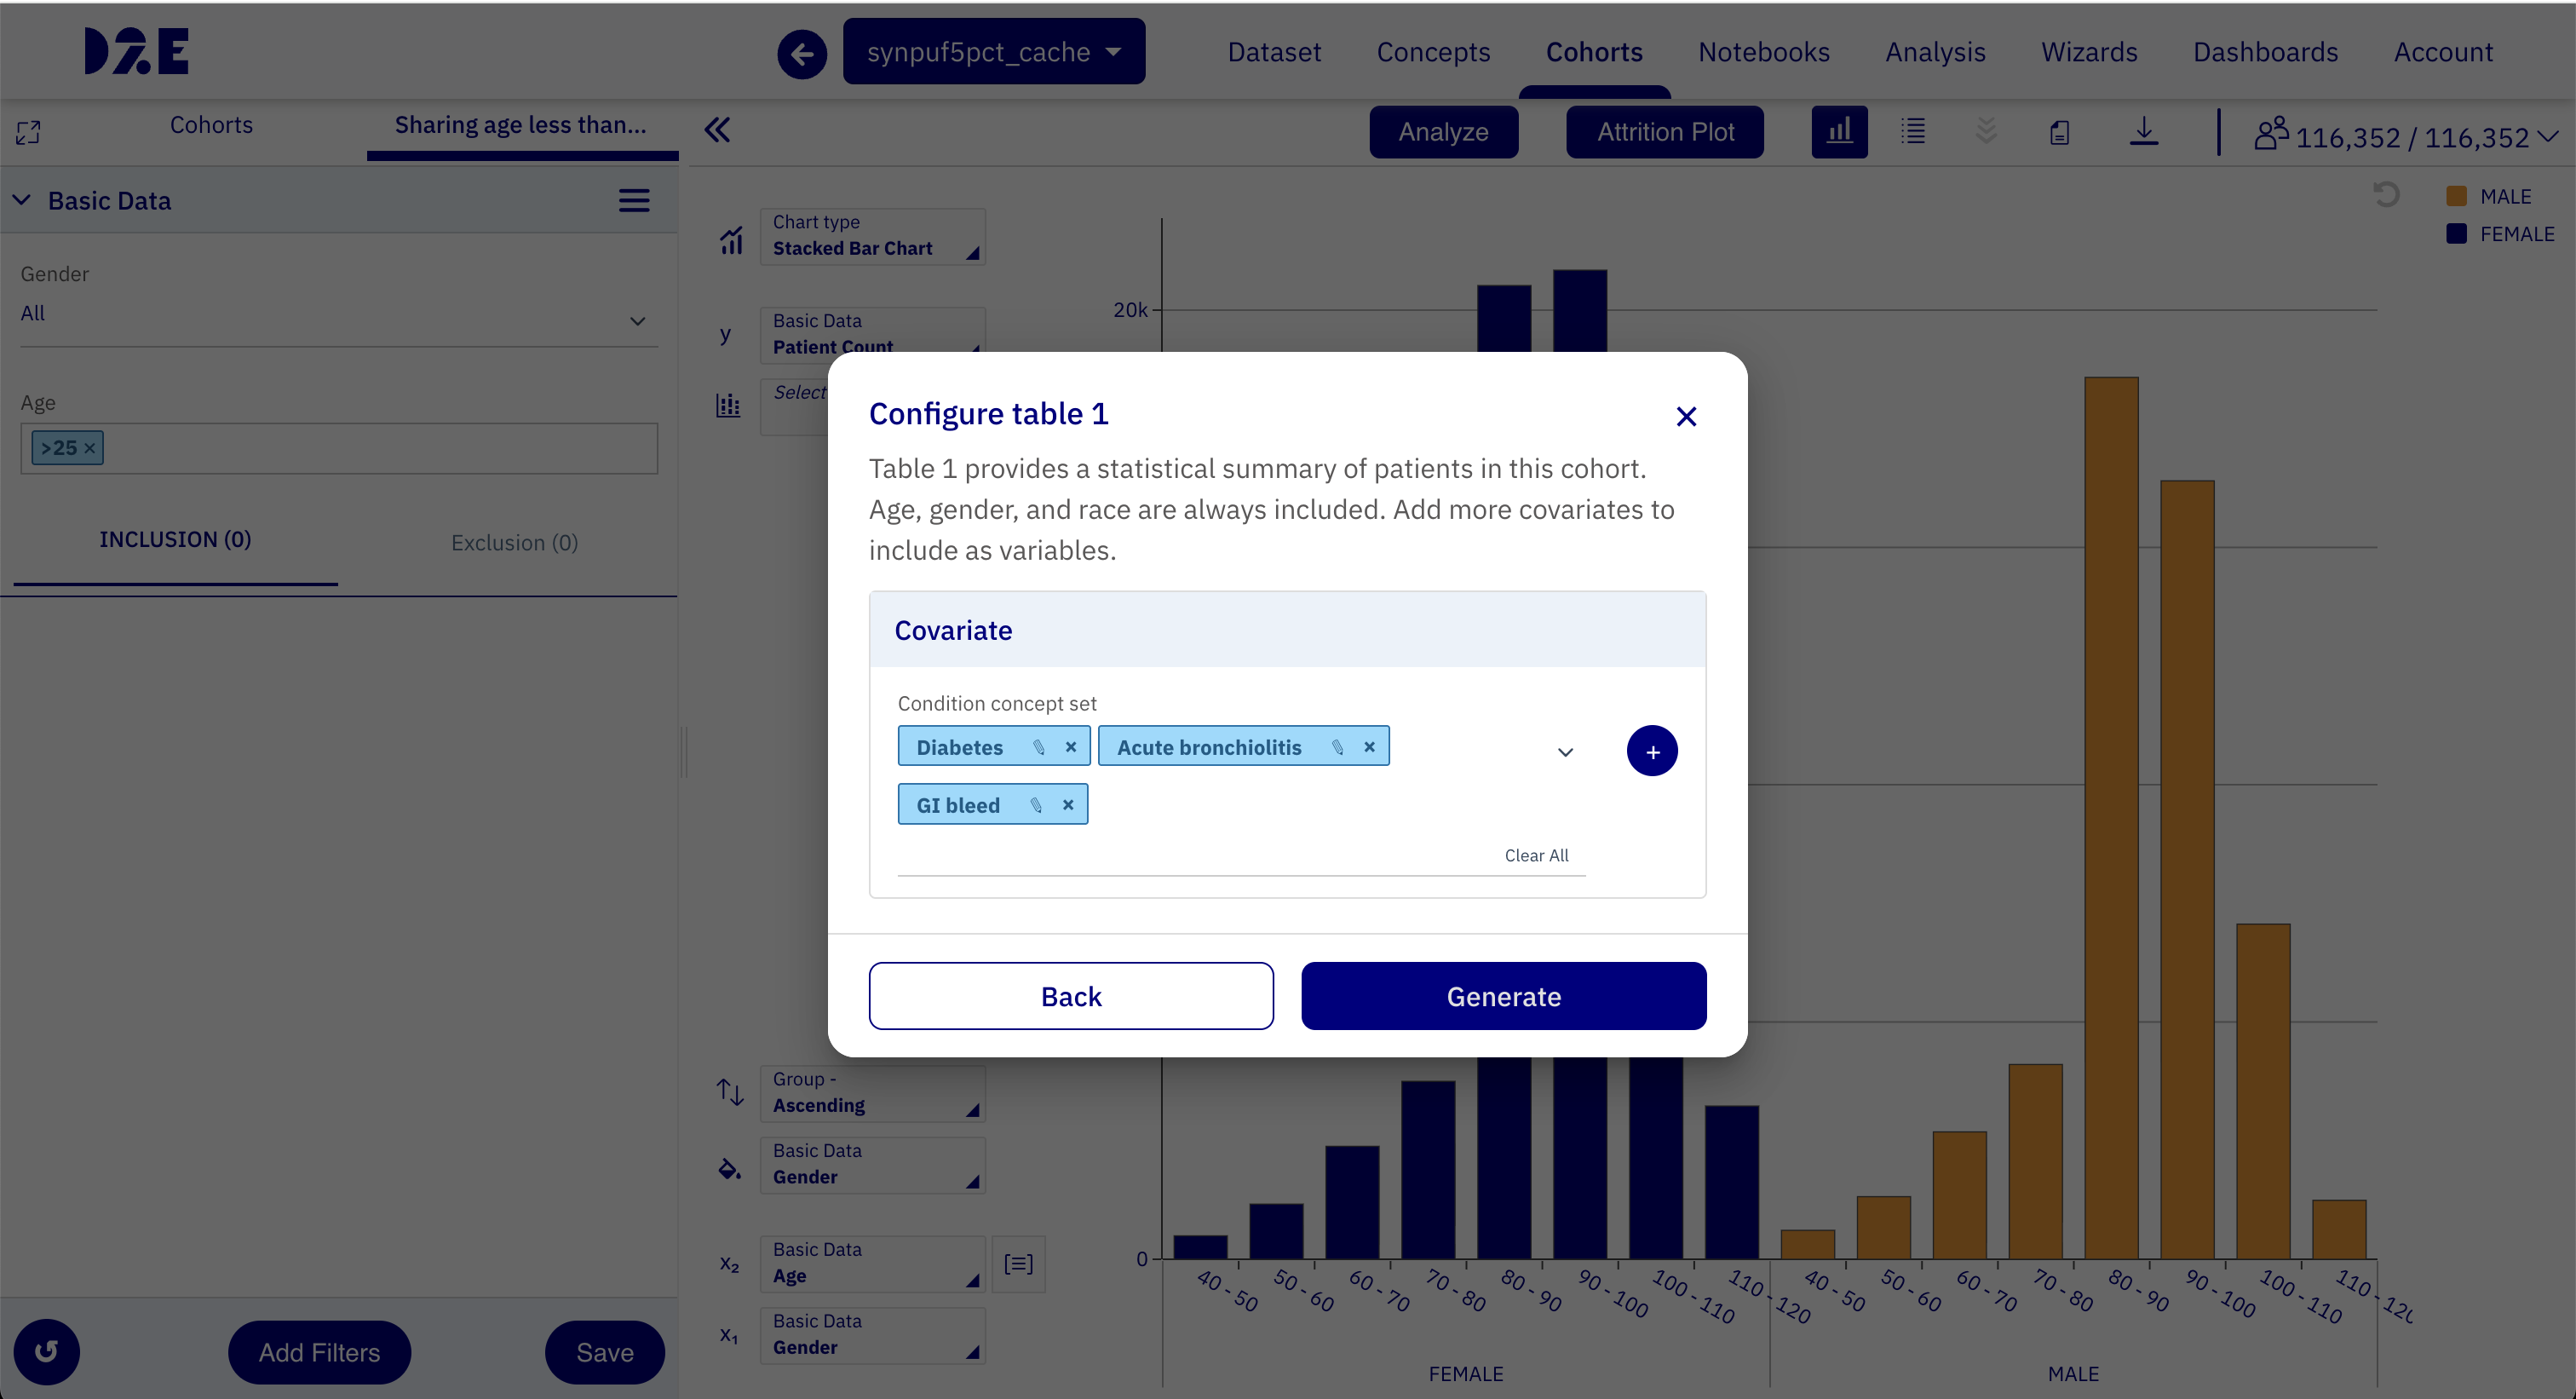
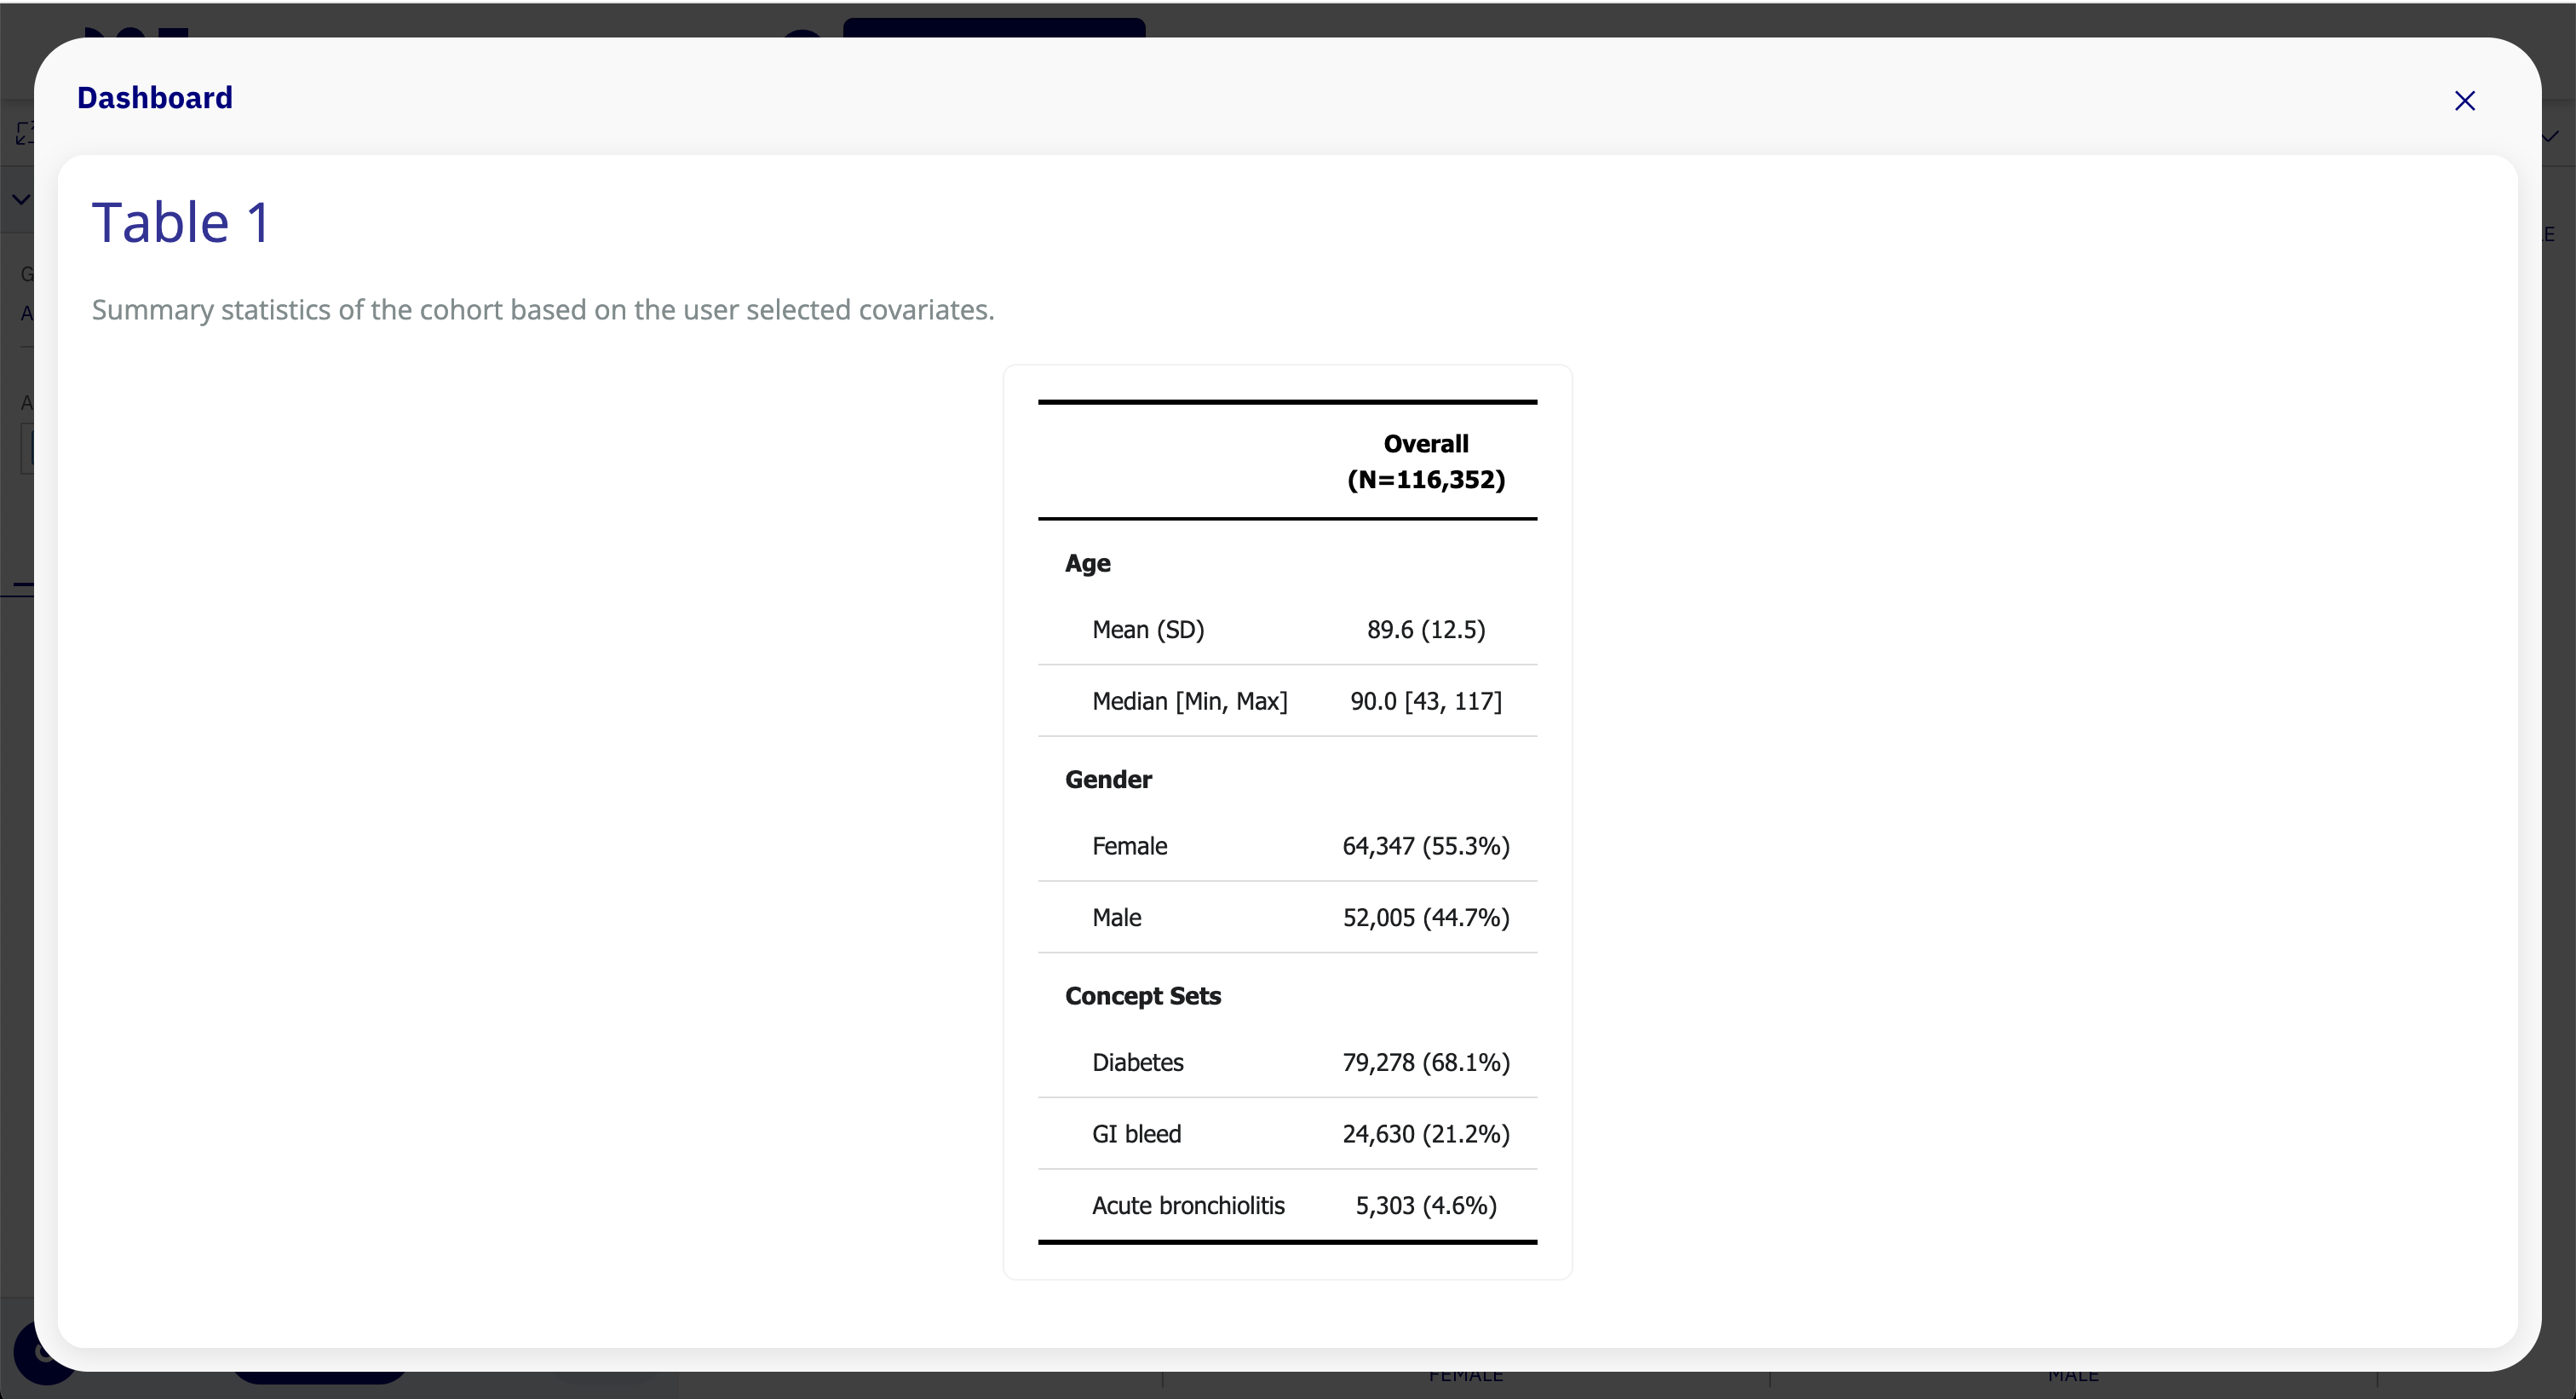
Step 4: Review the generated Table 1
Proceed to the dashboard to render the final output. The Table 1 view displays default covariates such as Age and Gender, along with user-selected concept set covariates.
Notes
- You can choose as many concept sets as needed for the same cohort.
- Table 1 results depend on the currently selected dataset and materialized cohort.
- If privacy thresholds are configured, low-count outputs may be suppressed based on system policy.